 23
23Sky & Telescope's year-at-a-glance guide to celestial happenings is a symphony of detailed calculations and clear, elegant design.
If you're an active backyard observer — or just celestially curious — you're always looking for quick, reliable information about "what's up" in the nighttime sky. When is the next new Moon? Can I see Saturn tonight? When will twilight end?
Sky & Telescope
The editors at Sky & Telescope are no different. And while we have scores of detailed references to draw from, one of the handiest is the "Skygazer's Almanac" found in every January issue of the magazine. This single sheet represents a fruitful melding of detailed computations and graphic representation that has been perfected over the years.
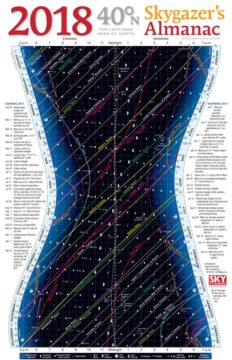
A graphical sky almanac has accompanied every January issue of Sky & Telescope since 1942 — that's more than 70 years! The main purpose of this chart is to let you see, at a glance, which planets and constellations are visible, and what the Moon's phase is, on any given date and time of night throughout the year.
There have been three "epochs" of this chart since its inception. From 1942 to 1980, each January issue featured the "Graphic Timetable of the Heavens," prepared annually by the Maryland Academy of Sciences. Then for two years it was called the "Graphic Ephemeris," computed and drafted by Michael Jay Jones (who had done this work for the Maryland Academy before then).
These charts had the same basic content. They showed the hours of night increasing from left to right, while the dates of the year ran from top (January 1st) to bottom (December 31st). Smooth curves provided the times of sunrise and sunset, as well as the end of evening twilight and start of morning twilight. Additional curves gave the rise, transit, and set times of bright planets and stars. Moon symbols appeared at the times of its rising or setting each night, while other symbols indicated planetary conjunctions and oppositions.
Skygazer's Almanac: The Next Generation
As good as they were, both of those charts suffered from the limitations of black-and-white printing. So in 1983 Sky & Telescope introduced its own computer-generated chart, the "Skygazer's Almanac." We introduced some big changes then, as well as other enhancements and improvements over the years:
- Curves for the planets became color-coded for easy recognition.
- Small white dots now mark 5-minute increments horizontally and each day vertically.
- The Moon symbols actually look like its phase each night as it waxes and wanes.
- Symbols now give the dates and best viewing times of annual meteor showers.
- Custom visibility curves are added for predicted bright comets (Halley, Hale-Bopp).
Sky & Telescope
Two key upgrades have really improved the chart's overall utility. First, we omitted the daylight portions of what had been a rectangular graph. This gave the chart a pleasing hourglass shape and, conveniently, freed up space to list key evening and predawn events down the left and right sides, respectively.
Second, we made versions for different latitudes. The original was plotted for those living at latitude 40° north, for use throughout North America and much of Europe. But beginning in 1998, additional charts were created for latitude 50° north (handy for northern Europeans) and 30° south (for use in Australia and the southern parts of Africa and South America).
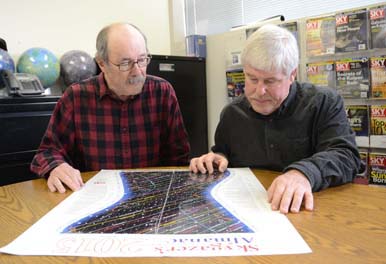
These charts aren't just used by backyard astronomers. If you visit any major observatory, don't be surprised if there's a "Skygazer's Almanac" hanging on the wall. In fact, we've always offered a 30-by-22-inch wall chart for those who wanted a more readable version than the one included with each January issue. In recent years this poster has been printed in full color, as well.
We pack a lot of information into each chart, and each is accompanied by a sheet of instructions that tell you what the symbols represent and how to "read" the events of a given night.
Sky & Telescope
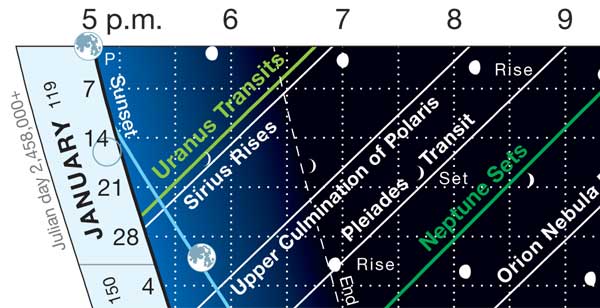
Take a look at the section above, which is shown at roughly the full size of the wall chart. You can see how the times of sunset and the end of twilight come later and later throughout the month. Moon symbols indicate that it's full on the evening of January 1st and again on January 31st. A dark green line shows when Uranus transits zenith and a lighter green line shows when Neptune sets. Other curves show when Sirius rises, the Pleiades and Orion Nebula transit the north-south meridian, and when Polaris culminates directly over the North Celestial Pole. Clearly, January is a busy month, celestially speaking!
The more you refer to this chart, the sooner you'll get a feel for the march of planets and constellations — not just during a single night but from week to week during the year. In fact, if you compare this year's chart with those from past years, you'll discover more and more about the clockwork of the heavens. For example, on charts eight years apart, the curves for Venus match almost perfectly — a celestial cycle known to the ancient Maya. On charts 19 years apart, the Moon makes its own encore performance.
Working up the "Skygazer's Almanac" takes a lot of effort — but it's one of the most rewarding projects I do all year. If you've got one, please add a comment below to let us know how you use it and what improvements we might make.

Comments
Condenser-Mike
January 29, 2015 at 12:13 am
I find this chart very useful. Thanks for keeping it great.
You must be logged in to post a comment.
Mick-Snyder
January 29, 2015 at 2:44 pm
+1 A constant source of useful information - I really like the format and easy to read graphics. 10/10!
You must be logged in to post a comment.
Jim DeCamp
January 31, 2015 at 11:30 am
I don't think it would be an exaggeration to call it a masterpiece; beautiful, useful, ever intriguing and delightful. Yes, thank you, many times over.
You must be logged in to post a comment.
Anthony Barreiro
January 29, 2015 at 4:15 pm
I read the Skygazers Almanac every week to keep track of sunrise and sunset, the planets, and the Moon. All this information is available from other sources, but the almanac puts it together in a clear and easily understood graphical format. I've seen similar "hourglass" charts, but the Skygazers Almanac is the most attractive and easiest to use.
You must be logged in to post a comment.
Rick-Hughes
January 30, 2015 at 5:15 pm
I have always considered this a work of art. So much information packed into such an elegant design.
You must be logged in to post a comment.
Steven-Elliott
January 30, 2015 at 5:20 pm
Do we digital subscribers get a copy?
You must be logged in to post a comment.
Monica Young
January 30, 2015 at 6:18 pm
Steven, the Skygazer's Almanac was included at the back of the January issue for digital subscribers.
You must be logged in to post a comment.
Mike
January 30, 2015 at 6:15 pm
Been using this for decades and appreciated it all along! Thanks for the snapshot into its history and making!
You must be logged in to post a comment.
Faye_Kane_girl_brain
February 2, 2015 at 2:47 pm
==-
As always, S&T is the one-stop-shop for observing-related astro info! I've been looking at the SG Almanac every year since I was in high school. And in all these decades, I never knew you sold a poster-sized version. Dammit!
Oh well. Another thing for my list of stuff to tell myself after I invent a time machine.
One thing though: the new dotted grid adds a HELL of a lot of visual noise. You need to make the dots smaller and a different color than the data lines on top of them. The only reason Edward Tufte isn't rolling in his grave is that he's not dead yet.
-- faye kane ♀ girl brain
You must be logged in to post a comment.
Roger W. SinnottPost Author
February 6, 2015 at 10:21 am
Hi Faye, thanks for your comments. But when you say "the new dotted grid," which version are you referring to? (wall chart, magazine chart, online, what year?) We've been doing the dotted grid since 1984. In the very earliest years we had a few problems with the dots. One year they came out a little too big, and another year they were way too small. But since 1999 or so we've been using exactly the same specs for the dots, and we don't think they produce excessive visual noise. (By the way, I too am a fan of Edward Tufte!)
-- Roger
You must be logged in to post a comment.
Mary Barnes
February 3, 2015 at 10:34 pm
I display the chart prominently in my office, and it is recruiting new stargazers. People ask me to explain it, and later they come by to find out what that "bright star close to the moon" is. I tell them to check the chart, and they are so excited when they find it!
You must be logged in to post a comment.
February 5, 2015 at 1:13 pm
Roger W. Sinnott,
Very helpful article. A humble suggestion: What computer program is used? Is it available for a PC, Mac or Linux OS? It would be immensely helpful for my work in paleoastronomy.
Thanks for providing this wonderful tool for all these years.
You must be logged in to post a comment.
February 6, 2015 at 12:29 pm
Roger Sinnott,
Your story motivated me to study the fascinating content packed into the skygazer graphic. Is the program available for PC, Mac or Linux OS. It might be extremely useful for studying some events that I'd like to investigate in paleoastronomy. How accurate would it be for years prior to 1500 CE? 1000 CE? etc. Currently, I use "Home Planet" software, but Skygazer might be much more flexible. Thanks for continuing this important and extremely useful work.
You must be logged in to post a comment.
Rick
January 3, 2018 at 7:04 am
I'd like to see a .PDF version available to subscribers to have on my laptop.
You must be logged in to post a comment.
Monica Young
January 3, 2018 at 1:48 pm
Hi Rick, All subscribers can get access to the digital edition. Download the January issue as a PDF and you'll find the Skygazer's Almanac (for all three latitudes) at the end of the issue. Feel free to email us at [email protected] if you have any trouble!
You must be logged in to post a comment.
Graham-Wolf
January 3, 2018 at 9:25 pm
Great work Roger, keep it up!
I've referred to your hour-glass chart for years.
It's easy to interpret, and frankly:- funnels lots of other folks charts into one simple physical artifact.
Anthony's praises pretty much echo my own.
It's certainly a useful and valuable "tool".
Graham W. Wolf at 46 South, Dunedin, NZ.
You must be logged in to post a comment.
YogiDimitrios
July 28, 2018 at 10:54 am
I'm curious about the Skygazer's Almanac.
Can you translate the 40 degree north latitude into other latitudes? For example, if I live at 35 degree north latitude, can I adjust the almanac to adjust for this?
Also, I see that there is a way to see moon phase and moon rising and setting times, but is there also a way to see which constellation the moon is in? Does the almanac have rising and setting times for constellations?
Thanks,
Dimitri
You must be logged in to post a comment.
okuijken
January 1, 2019 at 7:20 am
Is it possible to have the 2019 versions for 50N and 30S as PDFs? The on-line magazine doesn't seem to have them. Neither does shop@sky.
Thanks, Onno
You must be logged in to post a comment.
Monica Young
January 2, 2019 at 9:26 am
Hi Onno, You'll find the Skygazer's Almanacs for 2019 here:
50N: https://www.shopatsky.com/2019-skygazers-almanac-50-north-sga19n
30S: https://www.shopatsky.com/2019-skygazers-almanac-30-south-sga19s
You must be logged in to post a comment.
Allen
February 15, 2019 at 9:08 am
The Almanac is very useful. I haven't read an explanation for the linear scale on the midnight line. It seems to be the same each year for the 40 deg chart, so is it a component of the equation of time analemma curve?
You must be logged in to post a comment.
Roger W. SinnottPost Author
February 15, 2019 at 10:32 am
Thanks, Allen -- This scale gives the local sidereal time at midnight, which is the same as the right ascension of a star that happens to be crossing your local north-south meridian at midnight. (It has nothing to do with the equation of time.) There's a brief explanation on the back of the printed chart, at the bottom of the second column of the instructions, but it would be better to check an astronomy book if you want a more detailed explanation of sidereal time. -- Roger
You must be logged in to post a comment.
Mike Wilson
December 26, 2019 at 12:01 pm
I have used these since childhood when my grandmother would give the Maryland Academy of Sciences' Graphic Timetable of the Heavens, which I enjoyed, not only because it was useful, but because I could read and understand it and the other kids in the neighborhood were lost when looking at it. I find the S&T Almanac much more pleasing to the eyes and just as useful. Any chance you could come up with a wall chart for 30° N?
You must be logged in to post a comment.
rgaudin
May 7, 2020 at 10:19 am
How is calculated the the year appearing on the left: 2458 now and 2459 in June of 2020 ?
You must be logged in to post a comment.
You must be logged in to post a comment.