 2
2How can you measure and describe skyglow? Learn how to use the World Atlas of Artificial Night Sky Brightness and the Sky Quality Meter.
- What is Skyglow?
- The Light Pollution Atlas
- Finding Your Atlas Color Zone
- The Sky Quality Meter
- Magnitude Per Square Arcsecond
- The Distribution of Glow Across the Sky
- Interpreting the Atlas Colors
- Seasonal and Atmospheric Skyglow Variation
- Natural Nighttime Light Sources
What is Skyglow?
Light pollution is most amateur astronomers' worst enemy. There are two aspects to the problem: glare and skyglow.
Glare refers to light shining directly in your face — typically streetlights or your neighbor's "security" lights. Severe glare can make stargazing impossible, but most people can escape it by finding a shadowed corner, erecting screens to block the light, or traveling to a park nearby.
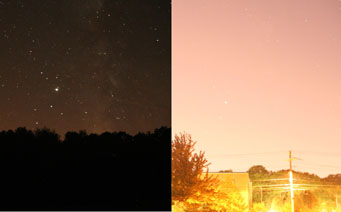
Here's the same piece of sky shot with identical camera settings at a rural site (left) and in a city. The Milky Way is completely overwhelmed by skyglow at the brighter site.
Tony Flanders
Skyglow, the diffuse glow that fills the sky itself, is harder to escape. A major city's glow is a serious problem anywhere within 50 miles (80 km) of the center, and it's visible for at least 150 miles.
It's extremely helpful to know how strong the skyglow is in your area to calibrate your expectations. For instance, the huge but very diffuse galaxy Messier 33 is quite easy to see through hand-held binoculars in a pristine sky, but it's extremely hard to make out even with a large telescope from a typical suburb, where the skyglow is many times more intense than the galaxy's light.
Traditionally, the quality of people's skies has been measured and communicated in terms of naked-eye limiting magnitude, or NELM. That's the magnitude of the faintest star that's just barely perceptible with averted vision directly overhead. On nights with good transparency, experienced observers typically measure NELMs of 6.5-7.5 in pristine conditions, and perhaps as low as 3.0-4.0 near the center of major cities. Unfortunately, NELM estimates of identical conditions vary greatly from one individual to another. That limits their value for measureming skyglow.
In the February 2001 issue of Sky & Telescope, John Bortle proposed a nine-classDark-Sky Scale based partly on NELM but also on several other criteria, such as the visibility of the Milky Way and whether clouds appear light or dark. (Near a city, clouds are lit up from below, but at a pristine site, clouds are black holes in the bright, starry sky.) Ratings on the Bortle scale tend to be more consistent than NELM estimates, but they still vary depending on individual skill and judgment.
Two innovations revolutionized the discussion of skyglow shortly after Bortle's article was published: the Web-based World Atlas of Artificial Night Sky Brightness, and the relatively inexpensive Sky Quality Meter. For the first time in history, these provide ways for typical backyard stargazers to assess and describe skyglow in completely objective terms, so that novices and skilled observers will obtain identical results.
The Light Pollution Atlas
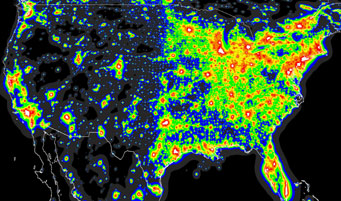
This is a piece of the North America sheet of the Atlas re-mapped to a traditional conic projection.
P. Cinzano / F. Falchi / C. D. Elvidge / Royal Astronomical Society
The World Atlas of Artificial Night Sky Brightness, published by Italy's Light Pollution Science and Technology Institute, is a contour map showing predicted skyglow over most of Earth's surface. (For the rest of this article, I will refer to this simply as the Atlas.) It's based on measurements of upward-shining lights taken by the U.S. Air Force's Defense Meteorological Satellite Program in 1996-1997, combined with a theoretical model of how skyglow spreads horizontally. Every spot on the map is assigned a color according to its predicted skyglow. The colors are (from darkest to brightest) black, gray, blue, green, yellow, orange, red, and white.
Before explaining how to use the Atlas, let me acknowledge its limitations. First, the underlying measurements are now (in 2009) more than a decade out of date, so they don't reflect the striking growth of light pollution in certain areas. The discrepancies are particularly great in the developing world and in the American Southwest, which is home both to some of the darkest areas on the continent and some of the fastest-growing cities.
The most light-polluted part of the U.S. stretches from Washington, D.C. at lower left to Boston at upper right. But even here, there are some relatively dark areas, including the Alleghany Mountains protruding across the left-hand margin, Adirondack State Park just dipping in from the north, and Catskill State Forest north-northwest of New York City.
P. Cinzano / F. Falchi / C. D. Elvidge / Royal Astronomical Society
Second, the skyglow model is experimental, and to simplify the computations, the efects of topography were intentionally ignored, except for the special case of Europe. Mountains can be quite effective at blocking skyglow, just as baffles inside a telescope tube block stray light, but this was not factored into most of the Atlas.
Finally, the maps' resolution is rather coarse. Each of the eight color zones represents a very large range of skyglows; people on the orange side of the yellow/orange border will experience very different conditions from those on the orange side of the orange/red border. And cities show just as white blobs, giving no hint of the fact that traveling a few miles within a city can easily change the skyglow by a factor of two.
Despite all these problems, the Atlas is immensely useful, and for the most part quite reliable. It's now quite common in Internet discourse for stargazers to describe to themselves as "in the red zone" or "in the yellow," without explicitly citing the Atlas.
Finding Your Atlas Color Zone
The World Atlas of Artificial Night Sky Brightness includes coastlines and international boundaries but no labels or roads. That can make it a little tricky to figure out where you are in the Atlas if you're not confident in your geography. And it doesn't help that the maps use a rectangular projection which is grossly distorted (stretched in the east-west direction) at high latitudes.

Here's the Clear Sky Chart's light-pollution map for Stellafane, Vermont. Note that this site, often considered dark by stargazers in the eastern U.S., is heavily light-polluted compared to most areas in the western U.S. Boston is the big white blob at right, Albany, NY is at left, and Hartford, CT, is at bottom center. The great paper-company holdings in Maine and northern New Hampshire protrude into the upper-right corner.
P. Cinzano / F. Falchi / C. D. Elvidge / Royal Astronomical Society / Clear Sky Chart
With a little care and effort, it's not too hard to puzzle out your location. Just remember that big cities show as white blobs and small cities are usually bull's eye patterns with a red circle at the center. With a conventional map at your side, it's pretty easy to figure out the correspondence.
But if you live in North America, there are a couple of computer aids that allow you to pinpoint your color zone very rapidly. First is the Clear Sky Chart, best known for its predictions of cloudiness, transparency, and seeing. If you select one of the individual charts (say, the site of Vermont's famous Stellafane star party), you will find a link labeled Light Pollution map right under the main chart. Click on this, and you get a section of the Atlas with the site marked by cross-hairs.
Even more convenient is Jonathan Tomshine's Dark Sky Finder website. This is an overlay of the North American sheet of the Atlas onto Google Maps. With it, you can zoom in on a particular street — bearing in mind that the underlying Atlas doesn't really support such a fine geographical scale. Tomshine is looking for volunteers to extend this to the rest of the world.
The Sky Quality Meter
The Sky Quality Meter and the closely related Sky Quality Meter with Lens (SQM-L) are relatively inexpensive devices that can measure skyglow directly. These provide much higher resolution than the light pollution Atlas, and they measure actual rather than theoretical skyglow. In particular, they're sensitive to the very large variatons (see below) that all sites experience due to atmospheric and seasonal effects.
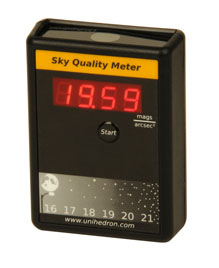
S&T Dennis di Cicco
The SQM averages brightness over ¼ to ½ of the visible sky, while the SQM-L has a field of view about 20° in diameter. Also, SQM readings are easily tainted by stray light (for instance, from streetlights or the Moon), which is much less true of the SQM-L. That makes the SQM-L more useful and reliable than the SQM in urban and suburban settings, where the view of the sky is often restricted and stray light is ubiquitous.
In general, both devices are extremely effective for measuring subtle differences among urban, suburban, and semi-rural sites, but they're not very good at distinguishing medium-dark from very dark skies. That's because they pick up natural as well as artificial light sources. That makes no difference in a city, where the natural light is a negligible fraction of the total. But at a remote site, the reverse is true; light pollution's effect on the readings tends to be drowned out by the rather large variations in natural light. So if one site reads 21.6 and another 21.8, the difference might be due either to residual light pollution or to the fact that the air is glowing more strongly than usual. It might also be due to instrumental error. SQMs are carefully calibrated, but there seems to be a variation of 0.1 to 0.2 magnitude among different units.
We'll discuss the natural light sources below. But first let's see how to interpret the SQM readings.
Magnitude Per Square Arcsecond
The SQM and SQM-L read out in magnitude per square arcsecond, a measure of surface brightness that's very popular among professional astronomers. (There's no common abbreviation for magnitude per square arcsecond, but for conveniene, I will write it as mpss in this article.) An SQM reading of magnitude 19.0 — typical for a medium-dark suburb — means that the sky glows as though the light of one 19.0-magnitude star were smeared out across each square arcsecond of sky.
Let's put that another way. When you look at the Milky Way through a telescope, you see countless individual stars, but to your unaided eye most of those stars blend into a diffuse glow. A sky that glows at 19.0 mpss from artificial light looks just as the Milky Way would if it were entirely composed of 19.0-magnitude stars spaced one arcsecond apart from each other. (Actually, that's not really true, because artificial light is generally much redder than starlight. But we'll ignore color for the remainder of this article.)
As with regular astronomical magnitudes, the bigger an SQM reading, the darker the sky is. See our article on Stellar Magnitudes if you're unfamiliar with this concept.
To give a sense of what mpss means in practice, here are some typical skyglow readings at the zenith (directly overhead) in various different situations. These are mostly based on my own measurements with an SQM and digital cameras. Coments about the Milky Way apply to mid-northern latitudes. (The Milky Way is much brighter in the Southern Hemisphere when Sagittarius is directly overhead.)
- 22.0 mpss
- By convention, this is often assumed to be the average brightness of a moonless night sky that's completely free of artificial light pollution. See below for a discussion of the night sky's natural light sources.
- 21.0 mpss
- This is typical for a rural area in the eastern U.S., with a medium-sized city not far away. It's comparable to the glow of the brightest section of the northern Milky Way, from Cygnus through Perseus.
- 20.0 mpss
- This is typical for the outer suburbs of a major metropolis. The summer Milky Way is readily visible but severely washed out.
- 19.0 mpss
- Typical for a suburb with widely spaced single-family homes. It's a little brighter a remote rural site at the end of nautical twilight, when the Sun is 12° below the horizon.
- 18.0 mpss
- Bright suburb or dark urban neighborhood. It's also a typical zenith skyglow at a rural site when the Moon is full. The Milky Way is invisible, or nearly so.
- 17.0 mpss
- Typical near the center of a major city such as New York or Boston.
- 13.0 mpss
- The zenith skyglow at the end of civil twilight, roughly a half hour after sunset, when the Sun is 6° below the horizon. Venus and Jupiter are easy to see, but bright stars are just beginning to appear.
- 7.0 mpss
- The zenith skyglow at sunrise or sunset.
The Distribution of Glow Across the Sky
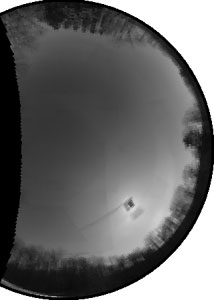
This photomosaic, covering about 65% of the sky, shows how unevenly distributed the Moon's glow is. The Moon itself is blocked by a shade to keep it from burning out the photo. See my blog How Brightly Shines the Moon? for more details.
Tony Flanders
Skyglow from artificial sources is distributed very unevenly across the sky. The zenith is relatively dark, because when you look straight up, there's less light-scattering air between you and outer space. As a very crude rule of thumb, glow from artificial light is twice as strong 30° above the horizon as at the zenith, and four times stronger 15° above the horizon.
Artificial skyglow also tends to be quite asymmetric. In a typical suburban setting, it's much stronger when you're facing toward the central city. Individual sources such as shopping centers, automobile dealers, and lighted ballparks create distinct light domes that can stretch surprisingly high into the sky.
At a site in the Northern Hemisphere, the glow toward the south is particularly important. Because skyglow is so much weaker toward the zenith, it's always a good idea to observe faint objects when they're as high as possible in the sky. (This also minimizes atmospheric absorption and distortion.) And at mid-northern latitudes, most celestial objects are highest in the sky when they're directly south of you. So if you're looking for a suburban home, it's smart to look in a city's southern suburbs, where the brightest glow is in the relatively unimportant northern part of the sky.
Glow from the Moon is even more asymmetric than artificial skyglow, making it very hard to characterize. It can easily be 10 times stronger near the Moon than on the opposite side of the sky, and it's much brighter below the Moon than above it.
Interpreting the Atlas Colors

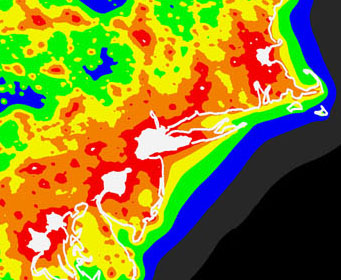
This is an excerpt from the Clear Sky Chart light-pollution map for Arizona's Kitt Peak National Observatory. Tucson, to the east-northeast of the observatory, shows the classic bull's-eye pattern of a city surrounded by wilderness. In such a place, a very modest drive can reduce your skyglow dramatically.
At Kitt Peak, the glow of Phoenix (at the top of this map) is visible along the northern horizon, and the eastern section of the sky is significantly compromised by Tucson. But overhead, south, and to the west, the sky is nearly pristine.
P. Cinzano / F. Falchi / C. D. Elvidge / Royal Astronomical Society / Clear Sky Chart
Now let's put this all together, and see what information you can glean from your location on the World Atlas of Artificial Night Sky Brightness. Throughout this section, I will assume that you're doing your observing only on nice, clear nights — ones with good transparency in astronomer's lingo. And I'll assume that all SQM readings are taken around 11 p.m. on summer nights, a time when many outdoor lights have been turned off, but most dedicated stargazers are still outside enjoying their hobby. See below for the modifications necessary at other times. And Milky Way visibility applies to mid-northern latitudes, including the United States, Canada, and most of Europe. The Milky Way is significantly brighter in the Southern Hemisphere.
In my magazine article, I divided the Atlas's eight zones into two groups of four, depending whether artificial skyglow at the zenith is stronger or weaker than natural skyglow. Another way to divide them would be into three bright zones (white, red, and orange), two transition zones (yellow and green), and three dark zones (blue, gray, and black).
In the bright zones, light pollution is strong in every part of the sky, and faint details such as the outer sections of galaxies are extremely difficult to see, if not impossible. In all three dark zones, the sky directly overhead is pretty close to pristine. But in the blue and gray zones, light pollution can still be a problem for observing objects that are low in the sky, particularly when you're facing toward the dominant light source.
Yellow and green, the transition zones, are harder to describe. Light pollution is perceptible everywhere, but in the better sections of the sky, with a little bit of effort, some surprisingly faint objects are still visible.
As stated above, a great deal depends in all cases on the direction of the brightest light pollution. For instance, the Clear Sky Chart puts Vermont's famous Stellafane star party just on the yellow side of the yellow/green border, which doesn't sound very good. But the worst pollution is to the northeast, where it doesn't matter much, and the south and southwest are relatively good. So Stellafane is better than its color zone suggests.
Here's my own personal assessment of the bright and transition zones. (I'll leave the three dark zones to people who visit them more often than I do.) Note that my ratings are somewhat different from the ones shown on the Clear Sky Chart.
- White (SQM < 18.8)
- The Milky Way is essentially invisible. In the darkest parts of this zone, experienced observers can see the Double Cluster and the Andromeda Galaxy fairly easily without optical aid. For most galaxies, only the cores are visible through telescopes.
- Red (SQM 18.8 - 19.8)
- Casual observers never notice the Milky Way, but experienced stargazers can see it fairly easily when it's high in the sky, on (Northern Hemisphere) summer nights. Galaxies are still pretty lackluster through telescopes, but they're much easier to see than in the white zone.
- Orange (SQM 19.8 - 20.5)
- Casual observers are likely to notice the Milky Way, and experienced ones can see it in all seasons except spring, when it hugs the horizon. Galaxies begin to become interesting through telescopes, showing considerable detail outside the core. Many nebulae are easy to see with the aid of narrowband filters.
- Yellow (SQM 20.5 - 21.2)
- The summer Milky Way is immediately obvious, and it shows a large number of dark lanes on close inspection. Experienced observers can see many deep-sky objects naked-eye, including possibly M33. Relatively bright galaxies like M31 show a great deal of detail through large telescopes, and much of their true size is visible.
- Green (SQM 21.2 - 21.6)
- The Milky Way is much sharper and crisper than in the yellow zone, beginning to show an intricate network of tiny dark lanes. The great Dark Horse Nebula is visible even as far north as latitude 45° north, but it's quite indistinct when it's that low in the sky. The zodiacal light is easy to see on moonless evenings in early spring unless it happens to coincide with the dominant light source. Telescopic observing can be quite good, with many famous "challenge" objects visible to experienced observers.
Seasonal and Atmospheric Skyglow Variation
Artificial skyglow tends to vary a lot both over the course of a single night and depending on the season. It's generally strongest in the early evening, then falls off fairly sharply between 9 p.m. and midnight as homes, businesses, and playing fields turn off their outdoor lights. After midnight it continues to tails off gently toward the predawn hours, probably because there are fewer automobile headlights. It's not uncommon for the glow right after the end of natural twilight to be 50% or even 100% stronger than in the pre-dawn hours.
Trees are very good at absorbing light — after all, that's how they make their living! So in areas with many deciduous trees, skyglow typically increases about 25% in the fall, with a corresponding decrease in the spring.
Fresh snow increases skyglow several-fold. You can even see this effect during broad daylight. Although the air is often very clear right after a storm, the sky is visibly whiter than usual because of all the sunlight reflected back into the sky. Artificial skyglow at night decreases rapidly as snow is cleared out of parking lots and from underneath streetlights, and then continues to decline more slowly as the snow becomes dirty.
Skyglow also varies tremendously depending on atmospheric conditions. The sky scatters much more light back to the ground when it's hazy than when the air is clear (or, as astronomers say, when the transparency is good). So in an urban or suburban setting, it's generally wisest to save deep-sky observing for nights with good transparency.
In rural areas, the effects of clouds and haze are more complex. That's partly because the weather can be significantly different where you are than it is around the city that's lighting up your sky. High cirrus clouds or smoke from forest fires usually amplify the light from distant sources, but low, dark clouds may actually reduce it. An extreme example — common in the coastal mountains of California — happens when a nearby city is blanketed by fog. This can blot out light pollution amazingly effectively.
Natural Nighttime Light Sources
Even a completely unpolluted sky is surprisingly bright, illuminating the ground enough for you to walk quite confidently through an open field. More than 90% of natural skyglow comes from three sources: the zodiacal light, uppper-atmosphere airglow, and starlight.
The zodiacal light consists of sunlight reflected off countless tiny dust particles (debris from comets and asteroids) that orbit the Sun. It fills the entire sky, but it's concentrated along the ecliptic — the orbital plane of the solar system — and it's strongest near the Sun and directly opposite the Sun. (The glow around the anti-solar point is called the Gegenschein.)
Airglow is similar to the fluorescent glow of luminous paint. It's caused by molecules in the upper atmosphere giving up energy that they absorbed during the day. It fluctuates considerablyl on multiple time scales.
Although starlight is by far the most obvious nighttime light source, it's actually somewhat weaker than airglow or the zodiacal light. The naked-eye stars contribute only a small fraction of the total starlight. Most of it comes from the combined glow of stars that can only be seen through a telescope — in other words, the Milky Way.
For convenience, it's often assumed that these sources add up to magnitude 22.0 per square arcsecond, though the actual value varies quite a lot depending on your latitude, the time of year and night, the direction you're facing, and many other factors.
The most comprehensive information on these subjects is a 1973 monogram, now long out of print, called The Light of the Night Sky, by F.E. Roach and Janet L. Gordon (Volume 4 in Geophysics and Astrophysics Monograms, D. Reidel Publishing Company). Wikipedia also has good articles on airglow and the zodiacal light.
This online article accompanies "Living with Light Pollution," published in the February 2009 issue of Sky & Telescope, which describes how skyglow affects what you see through a telescope and how you can combat its effects.


Comments
Frank Roy
December 24, 2008 at 10:03 pm
Superb article!
I am fortunate enough to have experienced a truly dark sky.
And this is only about two hours drive from Ottawa, Ont., a city with about 800,000 people. The site measured 21.82 with an SQM, (average of 10 readings). All the phenomena described in the article I have directly experienced, including airglow, zodiacal light , Gegenschein, and a shadow from the Milky Way. Under such truly dark skies the Milky Way is extremely large, well over 50 degrees in the Cassiopeia and Sagittarius regions. Areas of the Milky Way that appear to be the edge in a good rural sky are seen as just dark bands in such a spectacular sky, for the Milky Way extends far beyond the traditional edge. Indeed on at least one occasion this past September the Milky Way almost reached as far as Polaris and certainly within the great square of Pegasus. The South Galactic Pole is extremely obvious with its low stellar density. In the winter when Orion is transiting in the south the entire area is filled with stars and the Milky Way to the east of Orion is very obvious with a great multitude of stars visible.
With such a dark sky not only do you see many more stars (about 10,000 at this site) but the Milky Way covers a vast area of the sky, much larger that shown even on the best star maps.
Cheers,
Frank Roy
Elektra Observatories
You must be logged in to post a comment.
Joe North of Toronto
April 14, 2013 at 7:17 am
This would be a great way to historically chart the effects new development has on sky glow.
It could prove a Town is a leader in curtailing light pollution or that they are irresponsible or unaffected by progressive policy- and maintain outdated, expensive and unhealthy practices.
The rampant development coming to our area (Town of East Gwillumburry) will include three practically new towns. Sharon Village, Queensville and Holland Landing will change from small to expansive connected residential and commercial communities.
Currently the sky is a washout to our south (thanks Newmarket !) but some fair dark skies still exist at zenith and in the direction of the coming development.
This device provides an opportunity to collect quantitative proof of the before and after sky glow situation. Such information may then be used to prove to governments that unnecessary power waste, environmental and personal health damage continues to plague communities with outdated lighting policies.
In our case, there does not appear to be any lighting requirements placed on the developer. Rather the developer submits his lighting plan for approval. Requests for the Sharon Village plan have gone unanswered. There does not appear to be any overt information on a light pollution abatement policy or bylaw.
If your town is planning new development, please make sure your town addresses lighting at preliminary meetings with the community.
If you can help with mapping or advice on how to best collect this data, please write to lightright.notbright using the gmail mail server.
These areas are also near environmentally sensitive areas, so those with an interest in ecology, environment and nature, should also consider a group mapping my members, to chart changes.
Thanks
Joe
You must be logged in to post a comment.
You must be logged in to post a comment.