 0
0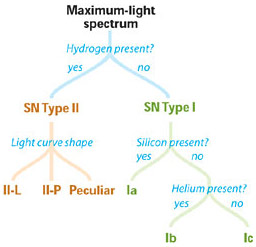
Supernova types are characterized by their chemistry and light curves.
S&T illustration; source: Astronomy and Astrophysics Encyclopedia (1994).
The only sure way to know that you've got a supernova in your sights, especially shortly after an explosion, is to capture a diagnostic spectrum. Basically, supernovae come in two flavors: those that have hydrogen (Type II, from a very massive star that blows up) and those that don't (Type I, due to thermonuclear runaways in a less massive star).
Both types exhibit a wide variety of subclasses. Type Ia is of no interest because these stars don't emit neutrinos. Types Ib and Ic are thought to undergo core collapse like Type II supernovae and, therefore, should emit neutrinos.
As Maurice Gavin explains in "The Revival of Amateur Spectroscopy", low-resolution spectra of objects as faint as magnitude 13 or thereabouts are accessible to modest amateur equipment. (A few superposed 20-minute exposures with a 12-inch telescope or so should produce an adequate image.) But what will supernovae spectra look like — especially shortly after the outburst begins — as captured by small telescopes and low-resolution spectrographs?
Here's your field guide. To prepare it, we started with high-resolution, calibrated spectra supplied by Alexei Filippenko (University of California, Berkeley). Then, to simulate Gavin's CCD results, we degraded the spectra to a resolution of 50 angstroms per pixel. Finally, and with dramatic results, we changed the intensity along each spectrum to reflect variations in the unfiltered sensitivity of popular CCD chips — the KAF-0400 from Kodak and the ICX055BL from Sony. Thus, what you see here is what you will get! (Astrophotographers using panchromatic emulsions will record spectra that look much like the originals.)
Let's Go to the Zoo!
Below are suites of spectra for different supernovae; to see all five sets of spectra, click here. The following descriptions are largely taken from notes supplied by Filippenko. One should keep in mind that the progenitors of Type II supernovae are heterogeneous, so it's not surprising that their spectra are heterogeneous too.
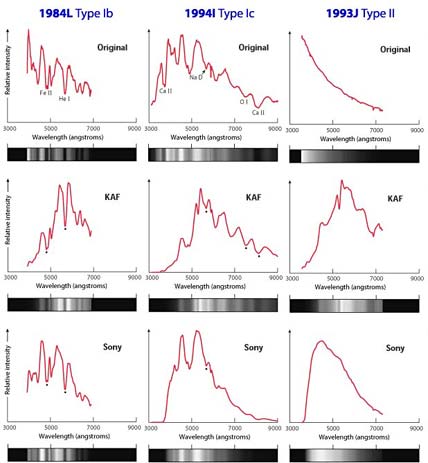
These examples of supernova spectra are depicted both as intensity tracings and as simulated CCD images; black dots mark conspicuous features identified in the 'Original' spectrum.
S&T illustration; source: Alexei Filippenko.
SN 1984L Taken about eight days after the explosion (the uncertainty is due to the unknown light rise time), this spectrum shows no evidence of hydrogen, but it does feature conspicuous absorptions due to neutral helium and singly ionized iron.
SN 1994I Taken about 12 days after the explosion, absorptions from calcium, oxygen, and sodium are evident in the original and KAF-0400 spectra. But because of the sensitivity response of the ICX055BL chip, most of these lines are missing from that spectrum. There are no conspicuous lines from helium.
SN 1993J Taken about three days after the explosion, the continuum is essentially featureless in the original. "Features" in the processed spectra result from the response curves of the CCD chips! For a while after a supernova explosion, spectra may exhibit no obvious details.
SN 1994Y Taken about 30 days after the explosion, this spectrum sports several emission lines but no absorptions. Three members of the hydrogen Balmer series are evident; a neutral helium line is also apparent in the spectrum.
SN 1987A Taken about seven days after the explosion, the spectrum of the most famous modern supernova contains strong features due to hydrogen. These lines exhibit so-called P-Cygni profiles, due to rapidly expanding gas, with emissions being bordered by blueshifted absorptions. SN 1987A evolved quickly; typical Type II supernovae wouldn't show such strong lines until later.

Comments
You must be logged in to post a comment.