 2
2Lots of you are probably fans of the hit TV franchise CSI. For those who aren't, the shows' forensic scientists use the barest shreds of microscopic evidence to determine the who/where/what/when/how of mystifying murders in Las Vegas or Miami or New York. It's amazing what the investigators can deduce from a single hair or a fleck of paint, but somehow they always puzzle it out.
Cosmologists show the same resourcefulness when trying to decipher the cosmic microwave background, or CMB, which is the relic radiation from the Big Bang. This fading echo of energy, redshifted into microwave spectrum by the universe's expansion, occurs all over the sky. Its discovery in 1965 earned Arno Penzias and Robert Wilson a Nobel Prize.
In the decades since, researchers have tried to discern the CMB's details, which hold many clues about how the universe began, and they've made great strides. For example, results from two NASA missions — the Cosmic Background Explorer and the ongoing Wilkinson Microwave Anisotropy Probe — reveal irregularities in the CMB, denoting slight concentrations of matter in the early universe that led to the formation of the first galaxies.
Now we're getting a first look at a new and even better all-sky map, collected by the European Space Agency's Planck observatory from August 2009 through late May and made public this past week. A press release from the United Kingdom Space Agency heralds it as "an extraordinary treasure chest of new data for astronomers."
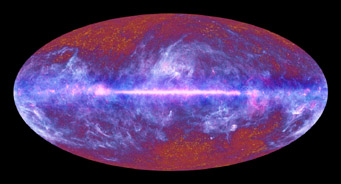
The microwave sky as recorded by Planck during its first 10 months of observation. Blue denotes dust in the Milky Way's disk, which runs horizontally across the center. Red shows regions of hot gas. Yellow mottling is the cosmic microwave background — relic radiation from the Big Bang. Click here for a larger view.
ESA / LFI & HFI Consortia
The new view shows some familiar territory in our cosmic neighborhood. Blue denotes dust that permeates the Milky Way's disk, which runs across the map's center, whereas red shows regions of hot gas. Click on the Planck image at right to see a larger view, and notice the web of cold dust that extends above and below the disk. These streamers, relatively nearby, trace out interstellar clouds that will someday churn out millions of stars. (By the way, ESA has only released a low-resolution version of the full data set.)
(Click here to see how the spacecraft made the scans that went into this map — and click here to compare it with images at other wavelengths.)
But Planck's mission isn't to explore the current and future state of our galaxy. Rather, its focus is the yellow mottling seen near the top and bottom of the map. Those subtle features, far from the hustle and bustle of the Milky Way, are what's got cosmologists salivating. The slight color shifts represent minuscule variations in temperature and density present about 400,000 years after the Big Bang, the early universe's blueprint for the galaxies we see today.

Planck separates from the launcher a couple of minutes after Herschel. The two spacecraft will independently head towards their respective orbits around the second Lagrange point L2, some 1.5 million km from Earth in the direction opposite to the Sun.
ESA / D. Ducros
Planck should complete four scans of the whole sky by the time its work ends in 2012 — the exact end date will depend on how long the cryogen lasts that's keeping its optics and detectors hovering near absolute zero. The final all-sky map should resolve details only 10 arcminutes across and in nine bands covering frequencies from 30 to 850 gigahertz (10 to 0.35 mm in wavelength) — good enough to distinguish sources within the Milky Way and in other galaxies from the CMB that lies beyond. Next January ESA plans to release the Early Release Compact Source Catalogue, a compendium of discrete Milky regions and galaxies detected by the spacecraft.
"This image is just a glimpse of what Planck will ultimately see," explains project scientist Jan Tauber. In particular, mission scientists hope the final map will be good enough to reveal the microwave signature of cosmic inflation — the growth spurt that caused the just-created universe to expand to 1078 times its volume in just 10-32 second.
For the moment, inflation remains a largely hypothetical event, even though it's a cornerstone of Big Bang cosmology. But Tauber and his colleagues hope Planck soon will build a rock-solid case for it.

Comments
Anthony Barreiro
July 9, 2010 at 11:54 am
This is a beautiful picture and a fascinating story. I've never really understood the orientation of these all-sky images, but the animation on the ESA website shows how the two-dimensional map relates to the three-dimensional sky. It's analogous to a map of the full earth, only looking up/out into the sky rather than down at the surface of the earth. A simple thing, but another little aha moment for me. Thanks Kelly for your clear and concise explanation of the cosmological significance of this image / data set. By the way, this is another fine argument for investing in robotic space missions rather than sending humans to Mars. Talk about (big) bang for the buck!
You must be logged in to post a comment.
Adolf Schaller
July 9, 2010 at 1:32 pm
If the cheif subject of attention is the CMB, they ought to produce polar projections, each centered on the north and south galactic poles.
Because of the distortion near the edges, it's almost impossible to discern the structure of the CMB with this conventional galaxy-centric mapping. A pair of polar projections with radii of 90 degrees could cover the sky as well, and greatly improve the distortion problem in those directions. 60-degree radii would work even better.
Otherwise, yeah, the Milky Way looks great at whatever wavelength, including microwaves. Always does. But we want to see the CMB decently for a change!
You must be logged in to post a comment.
You must be logged in to post a comment.