 0
0
By combining photos of the full Moon taken over two years, French astrophotographer Laurent Laveder created this fascinating animation that dramatically demonstrates the rolling motion known as libration.
Sean Walker
The Moon always keeps the same side facing Earth, because it is rotating synchronously (at the same rate) with its orbital period around Earth.
However, as Gary Seronik details in the May 2008 issue of Sky & Telescope, in reality we can see a little more than half of its surface thanks to a phenomenon called libration. Sometimes the “man in the Moon” looks as if he’s very slowly nodding yes or no to us — or both at the same time — over the course of a month. As a result of this side-to-side and up-and-down nodding, over time we actually get to see 59% of the lunar surface. (Click here to download Seronik's libration article as a printable PDF.)
The animation at right was created by French astrophotographer Laurent Laveder. He spent two years photographing the full Moon with the same equipment, and the result compresses two years' time into just two seconds! His animation shows not only how the Moon appears larger or smaller, depending on whether it's closer to or farther from Earth than average; it also captures the rolling and nodding of the disk due to libration. "The Moon is alive and is beating like a heart!" exclaims Laurent. (You can find out more about his project here.)
Here's a NASA simulation showing both the Moon's phases and its libration over the course of a year.
What I find interesting is that the Moon's libration can follow very different patterns over the course of the year. That's because libration is actually a combination of three nodding motions — in latitude, in longitude, and due to which side of Earth you're on at the moment — and they combine in various ways.
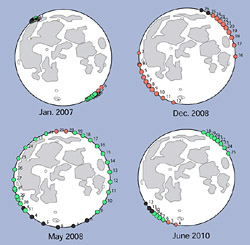
The pattern of libration on the Moon can vary dramatically from month to month. Here green dots show sunlit locations tipped at least 5° toward Earth on a given date. Red dots show librations that occur in shadow, and black ones those near new Moon. Click on the image for a larger version.
S&T: Roger Sinnott
For example, click on the image at right to see how much the libration pattern changes among a quartet of months. These plots were prepared by Roger Sinnott, one of S&T's senior editors.
Every dot represents a spot along the lunar limb that's tipped at least 5° toward Earth on that particular day. Green dots mean the librated spot is on the sunlit limb; red means the limb is in shadow (and thus unobservable); and black dots mark dates near new Moon (also unobservable).
Roger notes, "As you can see, in May 2008 we have an unusual situation, in that there is a good libration on nearly every day." But this coming December there won't be any favorable librations for the entire month!
Every issue of S&T has information on the month's best lunar librations — look for it in Chuck Wood's Exploring the Moon column. This information is also available in the Beyond the Printed Page section of most issue's online table of contents. Scroll down to the bottom to select the TOC for a specific month and year.

Comments
You must be logged in to post a comment.