 7
7There's more than one way to stretch your data . . . and the truth.
What does it mean to stretch your image? Simply put, stretching means scaling your data. Last month I talked about how data from a 12- or 14-bit camera might be scaled to fill the 16-bits of data range available for manipulation by image-processing software. This scaling is linear. For example, images from a DSLR camera range from 0 to 16,384 (14-bit), and that can be scaled by multiplying by 4 to cover the 16-bit range (0 to 65,535) for image processing, or it’s divided by 64 to make it fit the 8-bit range (0 to 255) that can be represented by your computer display.
Now, there are those who say that once you’ve stretched the data, you’ve destroyed it. Or, when you manipulate the data from the camera, you’re not getting a true representation of the object. As a computer science professional and graphics expert, I just roll my eyes when I hear this. Otherwise, I'd start an argument, which is much like the one I had with my daughter when she was six and insisted that the Moon followed us home from grandmas, because she saw it with her own eyes.
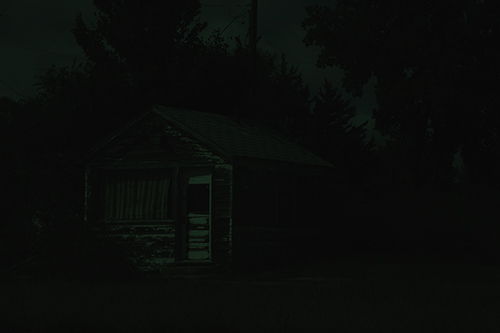
In fact, it's surprisingly hard to display a RAW image from a DSLR camera without any adjustments. Almost all software stretches data just to show it on a screen. (Let's skip the fact that the un-manipulated data isn’t in color — we'll talk about that some other time.) Here’s a colorized image from a well-exposed daytime shot right off my Canon DSLR:
Richard S. Wright Jr.
Pretty dark, isn’t it? That’s because it’s 14-bit data displayed in 16-bit containers like I talked about last month. When mapped to your computer’s display it has approximately one-quarter of the brightness range that it should have. Even if we scale it up by a factor of 4, you may still not be all that impressed.
Richard S. Wright Jr.
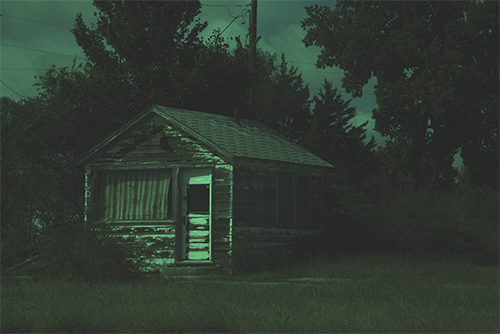
It’s still pretty dark even though the data range covers the full 16 bits (and is still linear). That’s right, the brightness values go up into the 65,000s. When mapped to your display, the pixel values go all the way up to 255, at least in the green channel. Did you notice that the image looks a bit green, not to mention flat and somewhat featureless? “Photography should be about what comes out of the camera, not the processing” . . . yeah, right. A modern DSLR does a tremendous amount of processing for you. If you are using a scientific camera for astrophotography, you have to correct for all kinds of things yourself, or else.
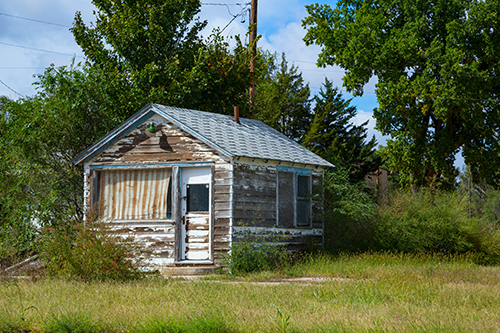
What does the above image look like if we open it in a typical DSLR RAW conversion program, and then do, say, 15 seconds worth of work on it? Ta-da:
Richard S. Wright Jr.
This image looks a lot more like what I saw on the side of the road somewhere in Kansas. It’s not even remotely linear now. Neither, by the way, is the human visual system. I’m going to let that work on you for a minute or two. If it sinks in correctly, then you too can roll your eyes the next time you hear some "expert" claim that astrophotography is all just fantasy. Such experts are in love with data, to the point that they don't grasp what “photography” is about. I’m not sure a better example of “missing the forest for the trees” can be found.
Richard S. Wright Jr.
So, why am I using a regular terrestrial image to demonstrate this when we are talking about astrophotography? Because if I used an astrophoto, someone would probably still try and argue with me about what’s next, which is that astrophotography isn't special, (other than how we feel about it of course!). It’s just really, really, REALLY low-light photography. We have to pay a lot more attention to things we take for granted when there’s an abundance of light. And the low-light conditions means the process of stretching our data becomes a little more interesting.
Other than that, yep, we worry about the same stuff as in regular photography: We still have to color balance, stuff often looks too green right off a color camera, and we have to stretch the living daylights out of our data to get a good result. And if your image is under-exposed (which means it doesn’t have a good signal-to-noise ratio), it’s going to look terrible when you start stretching it.
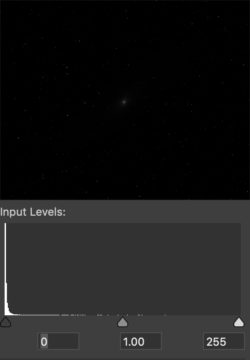
Let’s look at a typical monochrome astrophoto and its histogram. This is M31, the Andromeda Galaxy. The core shows up without any stretching, but most of the image is very dark. This result isn’t just about bit depth, either; it's because the image is very dark. As you can see in the histogram beneath it, most of the pixel values are down at the bottom of the brightness range.
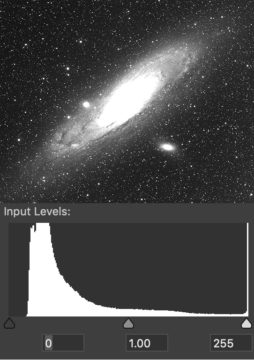
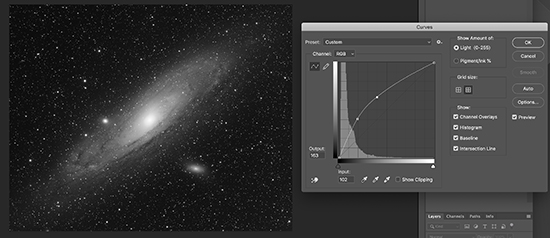
So, how about a nice linear stretch? Turns out we have to multiply the entire image by 256 to be able to see most of the galaxy well. Ugh, but look what happened to the middle part of the galaxy! It’s all solid white and saturated, and the histogram shows a tall, bright line all the way to the right. We’ve lost all the details in the center of the image because the middle is so much brighter than the outer part of the galaxy.
If you want to properly represent this object, you can't just do a linear stretch of the data. Perhaps one day, computer displays will have more than just 256 brightness levels; until then, we have to use a nonlinear stretch to compress the brightness range. This scaling helps us brighten the dark areas (the shadows) but not the already-bright areas (the highlights).
We usually perform this stretch with a "curve" tool, which applies a brightening factor to the image information in a nonlinear way. The end result is that we brighten up the shadows and kinda-sorta leave the highlights alone, or at least brighten them much less than the shadows.
Richard S. Wright Jr.
If you need to maintain the linearity of your data for scientific reasons, then a linear stretch can still make the data more interesting to look at, while still maintaining its scientific integrity. However, when it comes to non-linear stretches, I want you to consider a few things: The human visual system is non-linear (in fact, it's close to logarithmic), and we are capable of seeing a far wider dynamic range than any computer display can reproduce without some fudging of the data. We perform nonlinear stretches on photos of birds, sunsets, and bridal showers all the time, and no curmudgeons get on soap boxes about how the images are useless and misleading.
Perhaps we should just not argue anymore about what things we can’t actually see should look like!


Comments
John
February 15, 2019 at 4:32 pm
My wife invariably asks me if my astro-images really look like what I show her. Rather than have her eyes glaze over with any techie-talk (I'm a physicist and learned looong ago never to do that), I simply tell her the human eye can't see color at low light levels, so, no, you wouldn't see it looking through an eyepiece, just a nice gray blob. That usually satisfies her - until we get around to narrowband and color mapping, then all bets are off.
You must be logged in to post a comment.
Scott_R_K
February 15, 2019 at 5:38 pm
Hello ,
I'm sorry but I think you are mistaken when you commented on the Human Visual system being Exponential . It's Logarithmic . A simple Search will bring up the details or you can try this Link...
http://coolcosmos.ipac.caltech.edu/cosmic_classroom/cosmic_reference/linlog.html
Thanks for the Article .
Scott..............
You must be logged in to post a comment.
Richard S. Wright Jr.Post Author
February 15, 2019 at 11:58 pm
Scott,
I can see why this would confuse a lot of people, and I did actually change the wording to avoid a lengthy math lesson in the middle of the article. However, to be a picky computer science guy... "A Logarithm is just an exponent". Here's a good explanation of that statement:
https://brownmath.com/alge/loglaws.htm
Even for things you might traditionally think of as logarithmic, I tend to curve fit to the expression
y = x^b (^ is raised to the power of), where b is less than 1. This produces an inverse curve to what you would call exponential growth into what you would see as logarithmic. But they are basically the same, just flipped around if that makes sense. Any logarithmic equation can be rewritten in exponential form, and I guess I am biased towards that way of doing things. 😉
Richard
You must be logged in to post a comment.
Anthony Barreiro
February 16, 2019 at 6:15 pm
Richard, thank you for this tutorial series. I am not an astrophotographer, just a visual observer. From sharing star parties with the astrophotographers in my astronomy club, the expense, effort, learning curve, and frustration they incur also seem to fit an exponential equation! But I spend a lot of daylight hours looking at other people's pictures, and your tutorials have helped me to be a better informed consumer. I especially appreciate that you focus on fundamental principles, rather than the minutiae of software commands. So thank you.
One pet peeve of mine, that you may have addressed previously: pictures of galaxies or nebulae where the blues and reds are so vivid and saturated that the objects look like freshly cut pieces of fruit. I suppose this is a purely aesthetic decision, but just enough color is much more pleasing to my eye than way too much.
You must be logged in to post a comment.
madrobin
October 13, 2019 at 2:40 pm
Richard,
What a fantastic way to deal with subject. What I would like to understand is how stretching the data a ISO level work together. I have tried to take pictures of Milky way from my house ( fairly dark location), but end up with very bright images. It's probably because I use too high an ISO (1600, 3200). As I only get very pictures when I use low ISOs , I try wih higher ISOs. Also there are more confusion on the internet with articles on expose to the right theory.
I think I will try with ISO 400 next time and then stretch later in software. Do you think this is better approach?
Thanks.
You must be logged in to post a comment.
Richard S. Wright Jr.Post Author
October 14, 2019 at 10:59 am
I would use the method i outline to see if there is a drop off in noise as ISO increases. It really depends on which camera you are using, what your focal ratio is, etc. First determine how long you can expose without trailing stars, then work on exposure. If it is too bright, back down on ISO before backing down on exposure time as more light produces a cleaner image. If your camera is ISO invariant, you can shoot at pretty much any ISO you like, and keeping it lower will give you more freedom in processing later. Personally, I don't like exposing to the right as it saturates the brighter stars too quickly.
You must be logged in to post a comment.
madrobin
October 21, 2019 at 2:35 am
Hi Richard,
Thanks for the response.
Apologies for the various grammar mistakes in the previous post. I am ashamed. I use a Canon 6D and samyang 14mm f2.8 . I have used ISO1 1600 and 3200 at various intervals using the 500th rule. Having read many articles on well depth etc I fail to understand how ETTR can work. At the same time, what I am not sure is what the normal ISO for a given camera is. It has to sit somewhere between the top most ISO and lowermost ISO possible in a camera so that some leeway is possible to dial up / down the captured photon values?
I purchased your most recent book. I thought it might have more technical stuff but the photos are beautiful and gives us a guide on what can be used done when taking pictures. It would be really useful if you could add more stuff to it on sampling / resolution / pixel sizes in relation to image scale etc.
Thanks again for the response.
You must be logged in to post a comment.
You must be logged in to post a comment.