 0
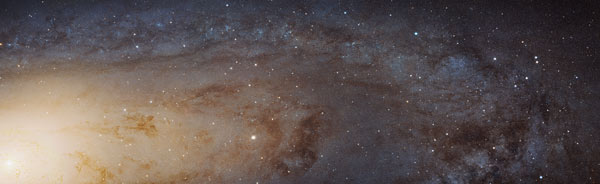
0The Hubble Space Telescope has turned its ultraviolet, visible-light, and near-infrared eyes to the queen of galaxies, M31, capturing the biggest and sharpest image yet of our neighbor.
At the winter American Astronomical Society meeting this week in Seattle, a poster of the Andromeda Galaxy welcomes astronomers to the biggest astronomy conference of the year. The poster is something like 10 feet tall and 25 feet wide — and that doesn’t even do the image justice.
NASA / ESA / J. Dalcanton / B.F. Williams / L.C. Johnson / PHAT / R. Gendler
The Hubble Space Telescope high-res image above captures a slice of Andromeda spanning 48,000 light-years, from bulge to outskirts. Its 1.5 billion pixels would need 600 HD television screens to display to full effect.
Hubble began studying Andromeda in December 2011 as part of the Panchromatic Hubble Andromeda Treasury (PHAT) project led by Julianne Dalcanton (University of Washington). The imaging project finished in November 2013, and the team released the result on January 5th at the meeting. The final image includes 12,834 shots from more than 400 pointings taken through ultraviolet, optical, and near-infrared filters. (The photo above shows only the visible-light view through the blue and red filters, a mosaic of roughly 3,700 optical images).
The team enlisted the help of well-known astrophotographer Robert Gendler, who stitched the images together to create the seamless mosaic. The stitching is so careful that the mosaic is aligned at the level of individual stars — roughly 117 million of them — or to better than one-tenth of an arcsecond. That’s not too shabby for charting a galaxy 2.5 million light-years away.
The result is a detailed look at our neighbor like we’ve never seen before, one best explored via the zoom tool on the European Space Agency’s Hubble site. (It takes a while to load, but it’s worth it.) Explore (and zoom, and zoom some more!) and you’ll see those 117 million stars, along with a couple thousand star clusters and star-forming regions as well as dark, twisted silhouettes traced by complex dust structures.
The Science Behind the Pretty Picture
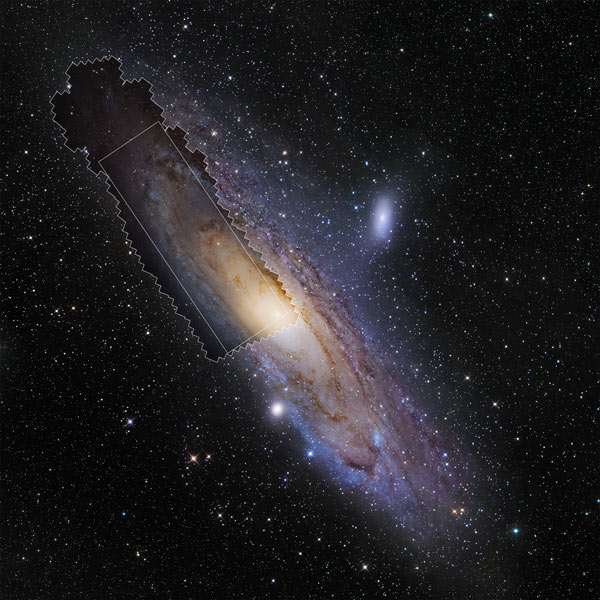
M31 PHAT Mosaic Credit: NASA / ESA / J. Dalcanton (University of Washington) / B. F. Williams (University of Washington / L. C. Johnson (University of Washington / PHAT team / R. Gendler; Credit for ground-based background Image of M31: © 2008 R. Gendler, Used with Permission
For Dalcanton, it’s the last item in that list — the twisted columns of obscuring gas and dust — that’s most interesting. Dalcanton has already used the image to map dust across the Andromeda Galaxy.
The team first divided the image into boxes 5 arcseconds (65 light-years) wide, each one containing foreground stars, background stars, and dust. As background starlight passes through intervening dust, it reddens just as a sunset reddens when passing through dust or smog. So for each box, Dalcanton’s team modeled the stars’ range of brightnesses and colors, and for each box they included two populations in their model: one reddened and one unreddened.
The result: a 3D dust map of the galaxy, one that has more than four times better resolution than previous dust-mapping methods. The team had to "fuzzify" the new dust map in order to compare it against other methods, but so far it’s in excellent agreement with previous charts in terms of the dusty structures’ shapes.
But surprisingly, the team found that other widely used dust maps actually predict twice as much dust as is really there. Dalcanton suggests a calibration issue with the other model as the most likely culprit. If that’s the case, nearby galaxies may have much less dust than previously thought.
Charting dust and its mysteries is essential to understanding starbirth, as dust helps to cool interstellar gas, and stars form from cool gas. This study is only the first from PHAT to aim for that ultimate charting goal. Forthcoming studies will study star formation as a function of position in the galaxy, investigate the galaxy’s star-formation history, and much more: “This is meant to be a legacy data set, to be used for decades,” Dalcanton says.
The Mystery Ring
Another surprise from the PHAT mapping is in the Andromeda Galaxy’s structure. Observations such as those in ultraviolet from NASA’s GALEX spacecraft and in infrared from the Spitzer Space Telescope reveal where stars are currently forming in the Andromeda Galaxy. As expected, star-forming regions riddled with young, massive stars trace out M31’s iconic spiral arms. The tightly wound arms — perhaps in some cases even genuine rings, like those created in a stone-disturbed pond — are likely a transient thing; computer simulations show that such arms should move and evolve over time.
GALEX and Spitzer images show the lay of the stellar land “now” (well, when light left the galaxy 2.5 million years ago). But because the color and luminosity of stellar populations reveal the stars’ ages, and because these properties change as you look at different parts of the galaxy, the PHAT images actually enable astronomers to look back in time and determine M31’s star-forming history in various locations.
What the team found is that the arms aren’t all as transitory as expected: a ring present today was also forming stars between 500 and 630 million years ago, a time scale much longer than astronomers predicted for these structures to survive. The inner and outer rings vary as expected, but not this one.
“This was really a surprise,” Dalcanton said in a press conference. In terms of stellar content, the density of stars in this ring is about 40% higher than in other regions in Andromeda, and it contains both old and young stars — it’s not just the young stars tracing it out, as is common with spiral structure. “So it’s this long-lived dynamical thing that’s just kind of sitting there, for reasons we don’t understand.”
At least, not yet.
Learn more about the team’s results on the PHAT project website.
Science Editor Camille M. Carlisle contributed to the reporting and writing of this news blog.


Comments
You must be logged in to post a comment.