 2
2The long-awaited analysis of spiral polarization patterns called B-modes affirms that these signals, purportedly from the universe’s early spurt of inflationary growth, are probably from dust in our galaxy instead.
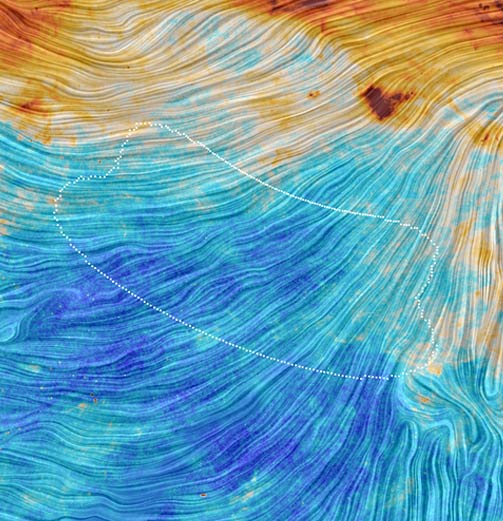
Credit: ESA / Planck
For the past year, cosmologists have been chewing on a conundrum. Last March, researchers with the BICEP2 experiment at the South Pole and its next-generation counterpart, the Keck Array, reported the detection of swirly polarization patterns called B-modes in the cosmic microwave background (CMB).
These B-modes, if in fact in the CMB itself, would come from spacetime ripples called gravitational waves that were created by the hypothesized nano-nano-nano-nanosecond of inflation, a brief but stupendous cosmic growth spurt right after the universe’s birth. Inflation explains otherwise baffling observations, such as why the universe is so uniform on large scales. And primordial B-modes would be a unique, direct confirmation that inflation happened. That’s why so many astronomers want to detect them.
Yet skepticism soon replaced the BICEP2 euphoria, when two other teams suggested the signals might instead be from dust in our own Milky Way. Aligned with our galaxy’s magnetic field, interstellar dust grains produce polarized emission of the same pattern and angular scale (a couple of degrees) as the B-modes cosmologists are hunting for in the CMB.
A preliminary analysis of dust emission from the Planck team, which has been laboriously working on its satellite’s all-sky observations of the CMB’s polarization, augmented the astronomical community’s skepticism. But that analysis didn’t address in detail the patch of sky BICEP2 and the Keck Array investigated, and all the previous analyses were extrapolations in one way or another.
To settle the debate, the BICEP2/Keck and Planck teams combined forces (and data) in a joint analysis. Scuttlebutt for the past several weeks has been that this analysis would dispel the cosmic claims, and on January 30th the teams fulfilled those expectations: in a paper submitted to Physical Review Letters, the teams’ analysis shows that the B-modes detected by the BICEP2 and Keck Array experiments can be explained by our galaxy’s dust. At most, gravitational waves from inflation could potentially make up only half of the observed signal.
The Dusty Details
Both BICEP2 and the Keck Array observed a 400-square-degree patch of sky near our galaxy’s south pole, a region free of much of the dust that fills the star-spangled disk. They focused on a frequency of 150 GHz, favorable for CMB studies. The Planck satellite, on the other hand, observed nine frequency bands, with seven of those — 30, 44, 70, 100, 143, 217, and 353 GHz — including polarization measurements.
As I’ve stressed in previous posts on this debate, Planck’s full data set is crucial in this investigation because it obviates the need to extrapolate. Instead of (educated) guesses on how dust emission changes from frequency to frequency, astronomers using Planck data can see the changes directly. Planck’s data show that emission from our galaxy’s dust is strongest at 353 GHz (25 times stronger than it is at 150 GHz, in fact) and that the signal strength at different frequencies follows the same relationship across the sky. That fact was imperative in understanding the BICEP2/Keck detection.
Because the dust is strongest at 353 GHz, the teams focused on the dust map from this frequency in their joint analysis. They carefully compared, combined, and cross-analyzed the observations in order to calculate the ratio of how big the spacetime ripples were compared with the ordinary density fluctuations in the material filling space. This ratio, r, is called the tensor-to-scalar ratio. Basically, it measures the strength of the gravitational waves and how energetic inflation was. A higher r means a bigger energy scale for inflation.
The teams calculated an upper limit of r < 0.12, which agrees nicely with the upper limit of r < 0.11 from Planck’s 2013 results (those included only the first 15.5 months of satellite data). Variations on the analysis shift r a wee bit up or down, but not enough to really change the conclusion.
These upper limits favor simpler forms of inflation. (Inflation is a framework, not a single theory, with different energies and behaviors.) The energy scale implied for inflation is still about 2 x 10¹⁶ gigaelectron volts, matching the energy level expected for the merger of the strong, weak, and electromagnetic forces into one. Physicists think these forces were united in the first mini-moment of the universe, then broke apart. Maybe the energy from that decay fed inflation?
What’s important is that the r value from the joint analysis is an upper limit, says inflation codeveloper Alan Guth (MIT). If the energy scale of inflation turns out to be much lower, cosmologists will need to focus on “slow-roll” inflation models, in which the potential energy that drives inflation decreases slowly (well, for inflation), like a ball rolling down a shallow hill. Slow-roll inflation falls under the “simple inflation” category.
A lower energy scale would also be friendlier to string theories, which seek to unite quantum mechanics and gravity.
Something to See Here?
It’s still possible that primordial B-modes hide in the CMB. The Planck data show that non-CMB contaminants (e.g. dust) are least problematic at a frequency of about 80 to 90 GHz. In 2014 the Keck Array observed at 95 GHz (data currently under analysis), and BICEP3 will add to that work this year.
Other teams, such as the Polarbear/Simons Array collaboration, are also working to increase their sensitivity and add multiple frequencies so that they can better disentangle the dust and underlying CMB signal.
The news isn’t all bad: the teams did confirm they detect lensed B-modes, B-modes created in the CMB by the lensing effect of cosmic structure. Other experiments have detected lensed B-modes before, but never so clearly (these have a trillionth of a chance of being a fluke).
And Planck is much more than just B-modes. The team presented their full data in December at a conference in Italy (you can scroll through the presentation slides on the conference website), but the release of the official papers with full analysis is imminent. Those will include refinements to cosmic parameters such as the universe’s expansion rate and its age. We’ll update you on those when we have them.
Reference: BICEP2/Keck and Planck Collaborations. "A Joint Analysis of BICEP2/Keck Array and Planck Data." Available on the Planck publications website.


Comments
Mark Looper
February 6, 2015 at 10:47 pm
One has to salute this team for casting doubt on their own potentially Nobel-Prize-winning discovery. Somebody once asked me what the most important characteristic for a scientist is, and I had to say it was the ability to admit one is wrong -- or perhaps more important, the willingness to try to prove oneself wrong. With science getting more and more specialized, there's nobody as well equipped to find the flaws in an observation or or theory as the originators; thus it has to be their duty to do their best to find any such flaws. A pompous-sounding statement, perhaps, but inescapable...
You must be logged in to post a comment.
Robert-Casey
February 9, 2015 at 12:10 pm
That above map looks like a Vincent Van Gogh painting. 🙂
You must be logged in to post a comment.
You must be logged in to post a comment.