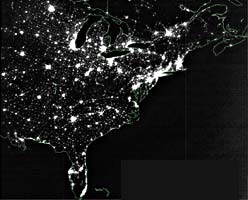
Billions of watts of wasted electricity stream continually into space as light from cities and towns around the world mask the stars from our view.
Despite some people who apparently don't think that the lack of stars visible in the night sky is important, astronomers and environmentalists very much care about how wasted light is brightening our once-dark skies. Light pollution not only robs suburban residents of their view of the Milky Way, it's also an indication of how much energy and money is wasted by inefficient, improperly directed outdoor lighting.
To give people a real sense of the problem, a National Science Foundation–funded experiment, organized by the Windows to the Universe project of the University Corporation for Atmospheric Research (UCAR), is recruiting people to examine their night sky. For the first two weeks in October, you can participate in a world-wide study to determine just how starry a starry night now is.
The task is easy. Go to the Great World Wide Star Count website and print star charts for your observing location. Everyone in the Northern Hemisphere will look at Cygnus; everyone south of the equator will look at Sagittarius. Each of the seven maps shows stars down to a different magnitude limit (plus one for a cloudy sky).
Don't worry, you don't actually have to count all the stars in the field. Just go outside in the early evening and note the map that best matches the view with your unaided eye. Which one has the faintest stars you can see is what you'll report back via the website.
This makes it very easy. The whole family can participate, and you can do it several times during the course of the two-week-long experiment.
 5
5
Comments
jim cameron
September 29, 2007 at 12:49 am
This could be fun!!! With the up coming Orionid's I may be able get the fam out to see what they can't see.
You must be logged in to post a comment.
Jeff Stevens
September 29, 2007 at 5:36 am
I'm assuming that there's an intention to attract a whole range of observers to this project, both experienced and non-experienced alike. If this is the case, then I think someone involved with the project needs to take an urgent review of the star charts for the northern hemisphere. How on earth is anyone expected to use a chart which has no scale, no magnitude estimate, no star names, no constellation lines and no directional indicator, e.g. north, south, east or west?
It took me 20 minutes to gauge the scale of the magnitude 5 star chart for the northern hemisphere. It may be a bit slow on the uptake, but Cygnus is one of my favourite constellations, and I've been observing it for 10 years. I sincerely hope other people are finding it easier to interpret.
You must be logged in to post a comment.
Gail Calder
September 29, 2007 at 12:03 pm
How about at least labeling DENEB or, alpha, beta and gamma Cygni-to orient us. I did astronomical research at Harvard for 6 years and know what I am about. But J Stevens is spot-on; your maps generate vertigo. not data.
You must be logged in to post a comment.
paul rapp
September 30, 2007 at 8:01 pm
Hmmmm… I must spend too many nights looking up. I had no problem picking out Cygnus from any of the charts except the cloudy sky. Even the mag. 1 chart shows the correct position by inference. That said, I heartily agree with Mr. Stevens; the charts definitely need annotation if they are to be of any practical use.
My daughter home schools all five of her kids. This exercise would be perfect for all of them; a real hands-on science project with a real goal. A goal more concrete than just completing an assignment. But I'm not going to be available during the observing period to show them the proper place to look. The charts won't do that either. They need a bit of help. Please.
You must be logged in to post a comment.
Steve
October 3, 2007 at 3:50 pm
It took me a while to figure out the photographic charts on the website. Even then the size/resolution makes the higher magnitude charts practically useless. However the website does have an "Activity Guide" PDF with rendered charts that even the inexperienced should find easy to use.
You must be logged in to post a comment.
You must be logged in to post a comment.