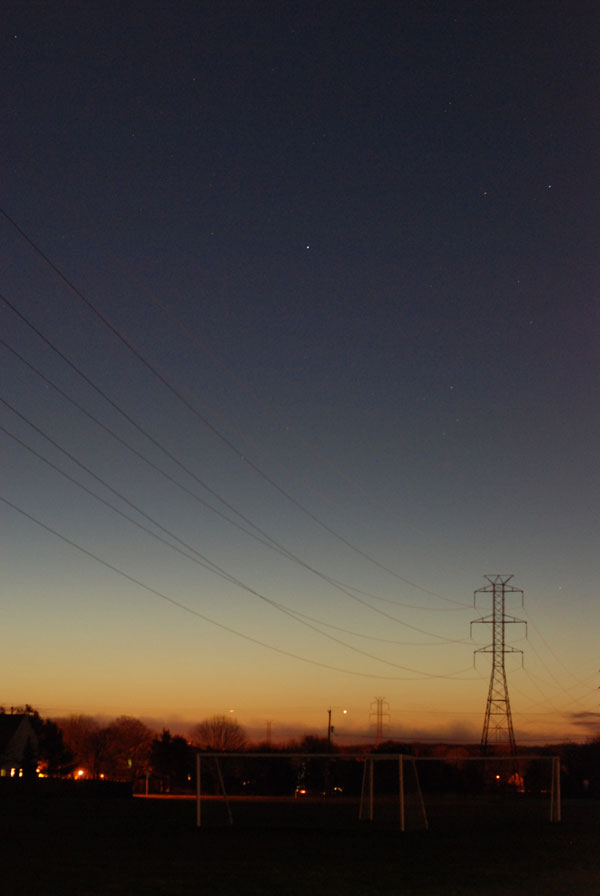
Inspired by a "Sun, Moon & Planets" column, the author spent the spring of 2017 tracking Venus's retrograde motion across the sky, exploring the relationship between the orbits of Venus and the Earth pointed out by Copernicus.

E. Roger Cowley
As seen from the Earth, the other planets move in an irregular way with respect to the stars. For most of the time they move from west to east, but for a fraction of their periods they move from east to west. The word “planet” comes from the Greek word meaning “wanderer.” The retrograde motion caused many headaches for early astronomers until Copernicus explained it in 1543, in his monumental book “On the Revolutions of Heavenly Spheres.” The apparent backward motion of the planets is caused by the relative motion of the Earth and the other planets as they all go around the Sun.
For the superior planets, the retrograde motion is more or less easy to see. In the summer of 2016, for example, Mars traced out its retrograde path against a background of fairly bright stars. When I observed it every two or three days, Mars’s movement against the stars was obvious to the naked eye. The other outer planets are less dramatic. In the case of Uranus, the whole retrograde part of its path covers only 4° of ecliptic longitude. The two inferior planets also have a retrograde part to their paths through the sky, but it happens while they move through inferior conjunction so that the planet is close to the Sun and it can be difficult to see its position relative to any stars.
I enjoy making quantitative measurements of the backward loops, and have measured the retrograde loops of each of the outer planets, with the exception of Neptune, several times over the last few years by taking star field photographs with a 50-mm lens on the camera, and measuring the positions on the photograph of the planet and three stars. These numbers, together with the celestial coordinates of the three stars, go into a spreadsheet that I have developed, which calculates the right ascension and declination of the planet. The values are usually good to about 1 second of time in right ascension and 15 seconds of arc in declination. I have described the whole procedure in a book, Gauging the Solar System: Measuring Solar System Values for Yourself. The spreadsheet can be downloaded from www.gaugingthesolarsystem.com/ra-and-dec-finder/.
Until last spring, I had never attempted to track either of the inferior planets through retrograde motion, although I had several times measured the paths of both Venus and Mercury around times of maximum elongation from the Sun. I had assumed that, when the planets were close to conjunction, it would be too difficult to take star field photographs that showed useful images of stars in the twilight skies. In his “Sun, Moon & Planets” column for the March 2017 issue of Sky & Telescope, Fred Schaaf pointed out that 2017 was a very good year for observing Venus because it would be close to its maximum separation from the Sun at inferior conjunction. I was already tracking Venus through its eastern elongation, which had its maximum value in January, so I simply carried on following it through the spring months.
Inferior conjunction was in fact on March 25th. The last day when I was able to take a usable evening photograph was March 16th, and the first morning when I could detect stars on a photograph was April 2nd. I was able to see Venus several times between these dates, but in the photographs the sky was too bright to show stars. Part of the reason it was so difficult was that Venus performed its retrograde motion in a region of sky with no bright stars in it — the stars that I was able to use were mostly of 4th and 5th magnitude. The results for the right ascension and declination, in the photographs taken close to inferior conjunction, were not quite as accurate as the values I had been used to getting for the superior planets. This could be in part because the stars that I could identify were all much higher in the sky than Venus, so I was making a long extrapolation in the coordinate transformation. Also, I knew that Venus appeared as a narrow crescent when seen through a telescope, whereas the image in my camera, while not exactly circular, showed no trace of the crescent. Presumably the numbers that came out of my spreadsheet corresponded to some sort of weighted center of the illuminated part. Fortunately, the errors are in fact quite small on the scale of the graphs I have plotted.

E. Roger Cowley
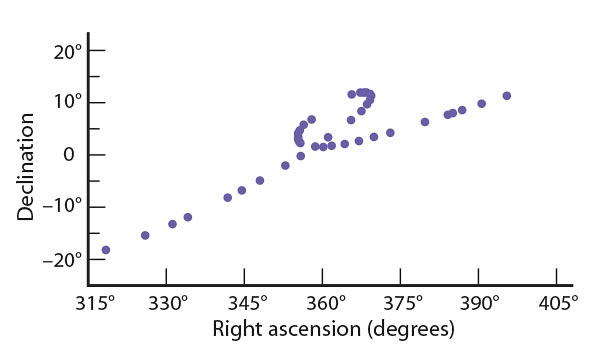
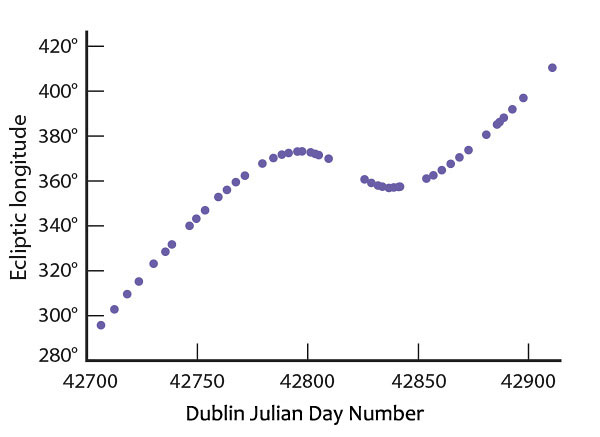
I can show the results in several ways. A graph of the declination versus the right ascension shows the shape of the loop much as it would appear to an observer. I have plotted the right ascension in degrees so that the horizontal and vertical scales are comparable. Remember that right ascension conventionally increases from west to east, or right to left in the Northern Hemisphere, so the loop would be flipped. The two reversals of the direction of motion are obvious. They occurred around March 2nd and April 13th, although that is not clear in this type of plot. It is straightforward to convert the right ascension and declination coordinates into ecliptic longitude and latitude. Even in this extreme case, Venus’s ecliptic latitude was never greater than 8.5°, so it is not much of a distortion to picture the motion as taking place in the plane of the ecliptic, with the changing ecliptic longitude spelling out the whole story. The graph of ecliptic longitude as a function of time, shown in the second figure, is then a reliable indicator of the timescale of the loop. I have actually plotted the time as days after January 1st, 1900, the epoch for the Dublin Julian Day, and I have added 360° to some of the longitudes to give a continuous curve.

E. Roger Cowley
I would like to emphasize that the points where the two curves change direction are called “stationary points” because Venus is apparently stationary with respect to the stars. These are not the same as the maximum eastern and western elongations. The maximum elongations are points when the angular separation of Venus from the Sun has reached its greatest value. However, at those points both the Sun and Venus, as seen from the Earth, are plodding around the ecliptic at approximately 1 degree per day relative to the stars. At the true stationary points, Venus actually falls behind the Sun, as viewed from Earth. The maximum eastern and western elongations occurred on January 12th and June 3rd, about 71 days before and after inferior conjunction, whereas the stationary points are about 21 days before and after the conjunction.
Tracking Venus through the complete set of elongations and retrograde motion and plotting the results brings out very vividly the relationship between the orbits of Venus and the Earth pointed out by Copernicus.
 1
1


Comments
Rod
November 13, 2018 at 5:18 pm
Very enjoyable report here. I tracked Jupiter, Mars, and Saturn this year using my telescope but visual observations with notes in my stargazing log. March 9 through September 6 this year using Fred Schaaf reports in S&T magazine for retrograde motion begin and end dates as well as checking the monthly planetary almanac and ephemeris tables. Good to see some still show evidence for the heliocentric solar system because YouTube has many videos proclaiming the Earth Immovable and flat today 🙂
You must be logged in to post a comment.
You must be logged in to post a comment.